

CO₂e Emissions by Transport Type
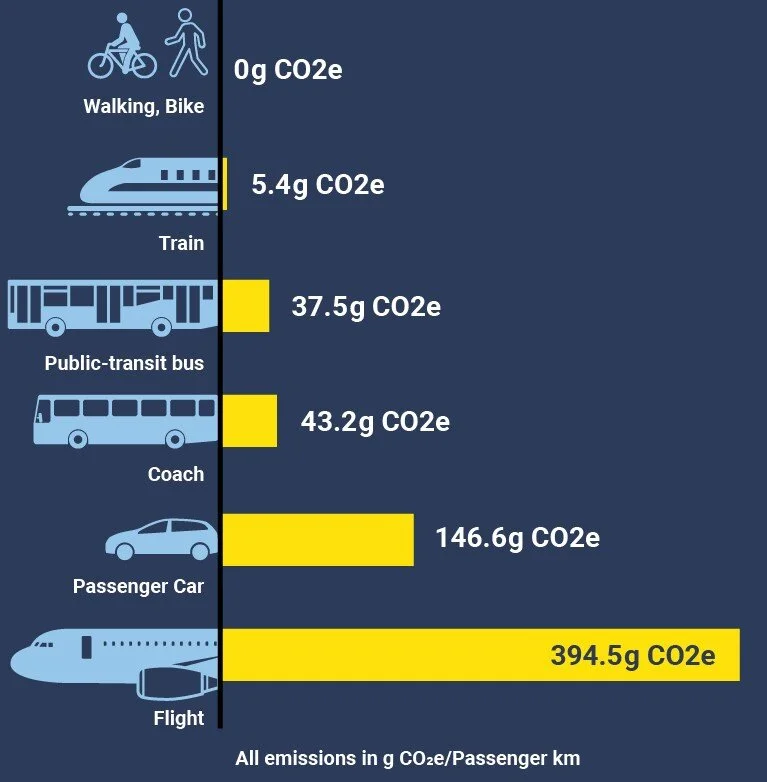 Source: Stay Grounded
This diagram compares the climate impact of different modes of transport.
Note: The data is from Europe, where electric rail is largely powered by renewables. In the U.S., only the Northeast Corridor Amtrak trains are electric — most others run on diesel.
How Amtrak Compares
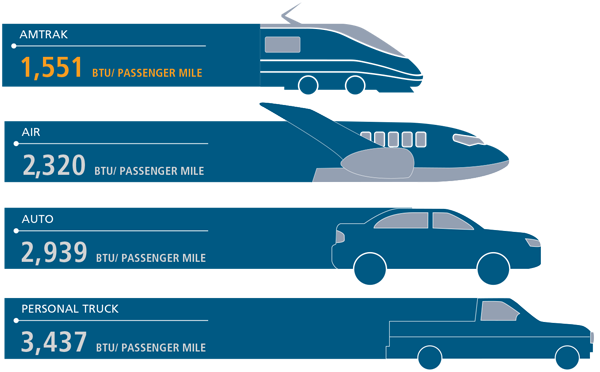 Source: Amtrak
This graph, published by Amtrak, compares the energy efficiency of different travel modes. However, it does not include aviation’s non-CO₂ warming impacts, which would place planes at the bottom of the efficiency ranking.
Also note: Car efficiency varies based on vehicle type and number of passengers.
Planning Resources
Travel Planning Websites
- Google Maps
- Wanderu – Easy interface for planning ground trips
- Rome2Rio – Discover how to get anywhere by train, bus, ferry, or car
Train Travel
Bus Travel
- Green Tortoise – Adventure travel by coach bus (includes food, lodging, etc.)
- Megabus – Express coach service between many destinations
- Greyhound Transit
Bicycle Touring
- Adventure Cycling Association – Maps, routes, guided tours, and resources for bicycle travel in North America
Car Trips
An airliner gets roughly 30 mpg per passenger, similar to a compact car.
However, compact cars with multiple passengers outperform airliners in efficiency — and they avoid the high-altitude, non-CO₂ warming impacts of aviation.
Cruise Ships
Cruise ships can be more polluting than flying.
Cargo Ship Travel
Sailing
- EcoClipper – Professional emission-free transport and travel by engine-less sailing ships
- Find a Crew – Find a sailboat and join as a crew member